
New runs and OTel
Darwin Wu · 7/19/2024 · 11 min read
Our new function runs UI and has been out as a beta for a little over a month now,
bringing 2 significant improvements to the user experience:
- Our new function runs UI and has been out as a betad of a linear timeline view, we’re now presenting function execution as a waterfall view.
- Each run can be expanded in place or have a dedicated page for it, so you no longer lose track of which run you’re looking at
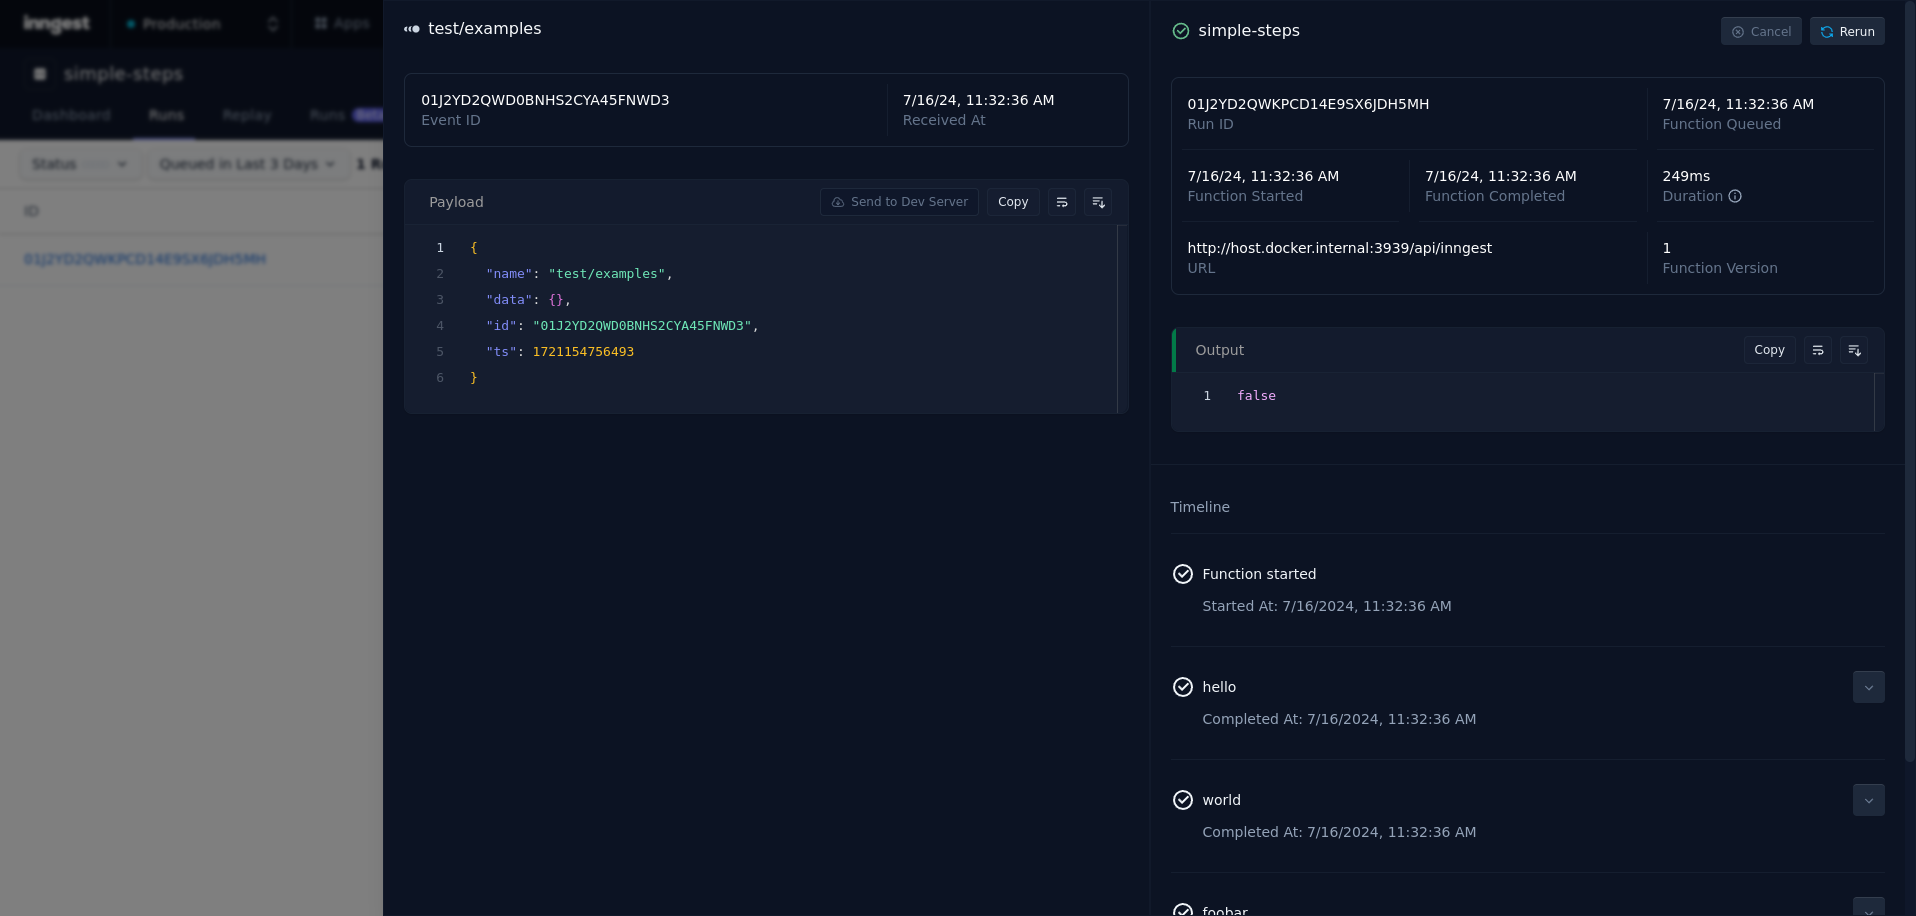
Existing version of function run view
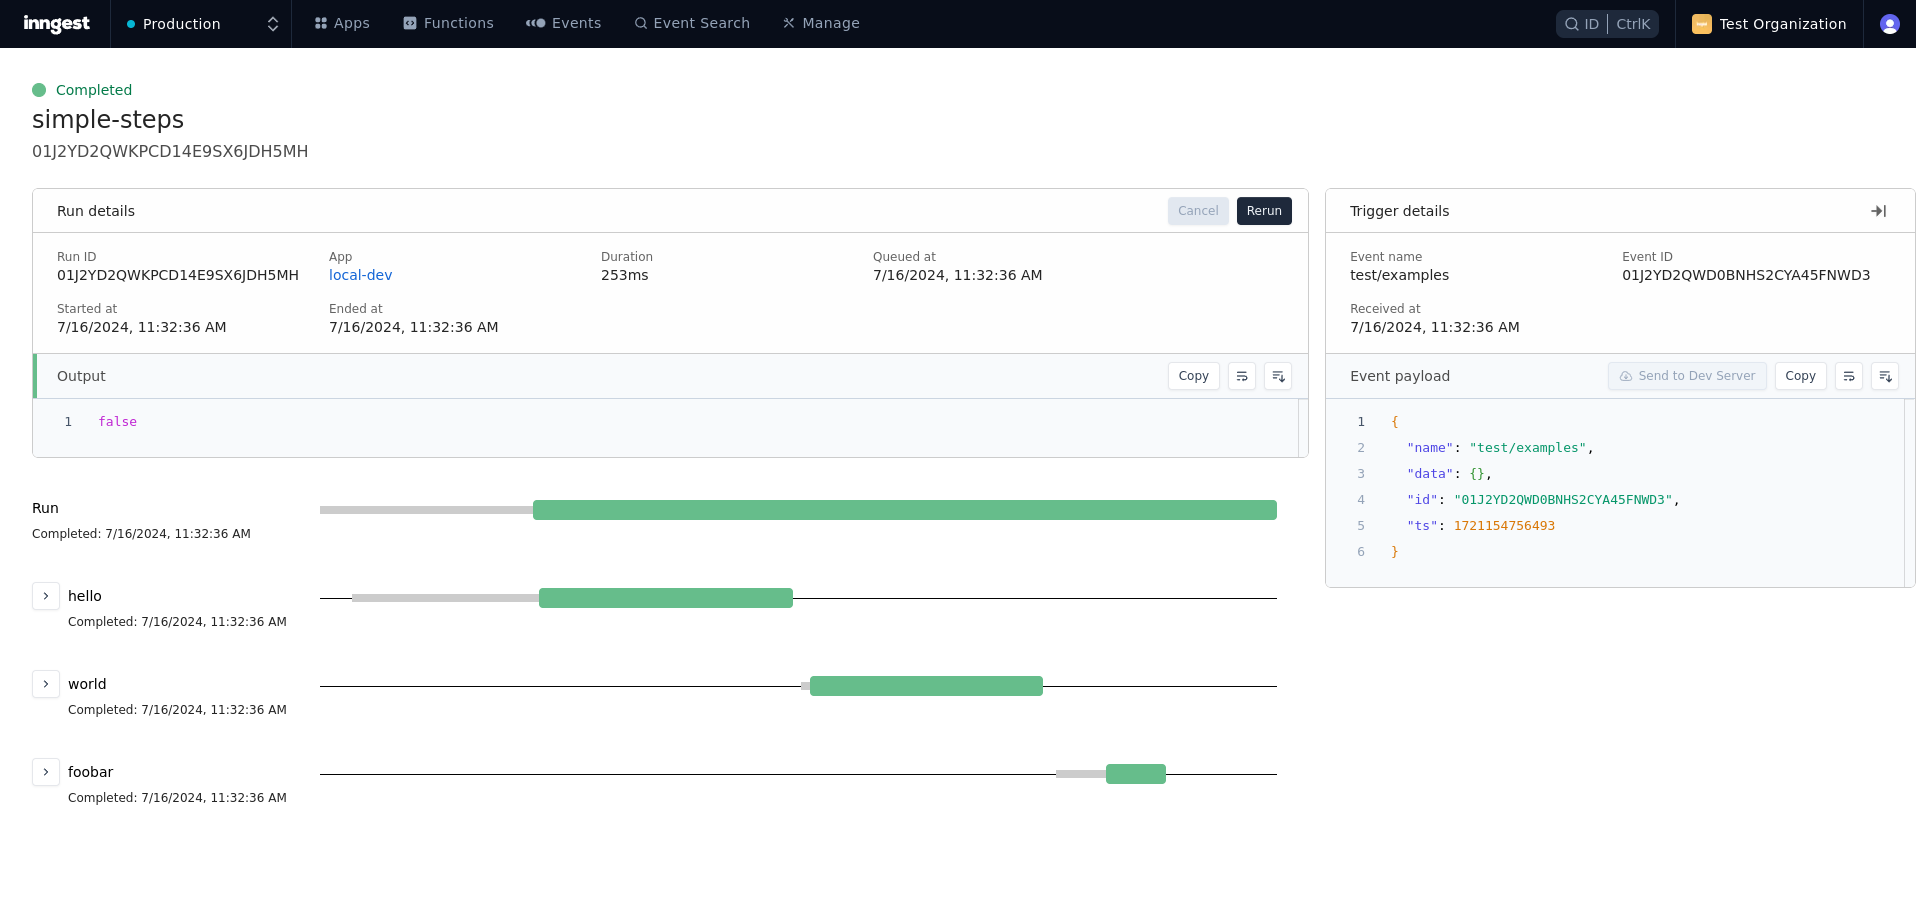
New version of function run view
The new execution waterfall view helps better navigate multi-steps worflows and better visualize timings and durations.
This helps, especially when you have things like parallel steps and concurrency limits, and it gives you a better idea of the state of the function run. Previously, all steps in a run were visualized in a vertical timeline, so it’s not easy to understand when each step happened and how it relates to other steps in the run. This is most apparent when you’re looking at parallel step executions.
With the new visuals, it’s more obvious at a glance.
When looking at our new runs UI, did you notice something?
You might have encountered similar waterfall UI in the past, for example, in the Chrome DevTools or while working on distributed systems tools like Jaeger.
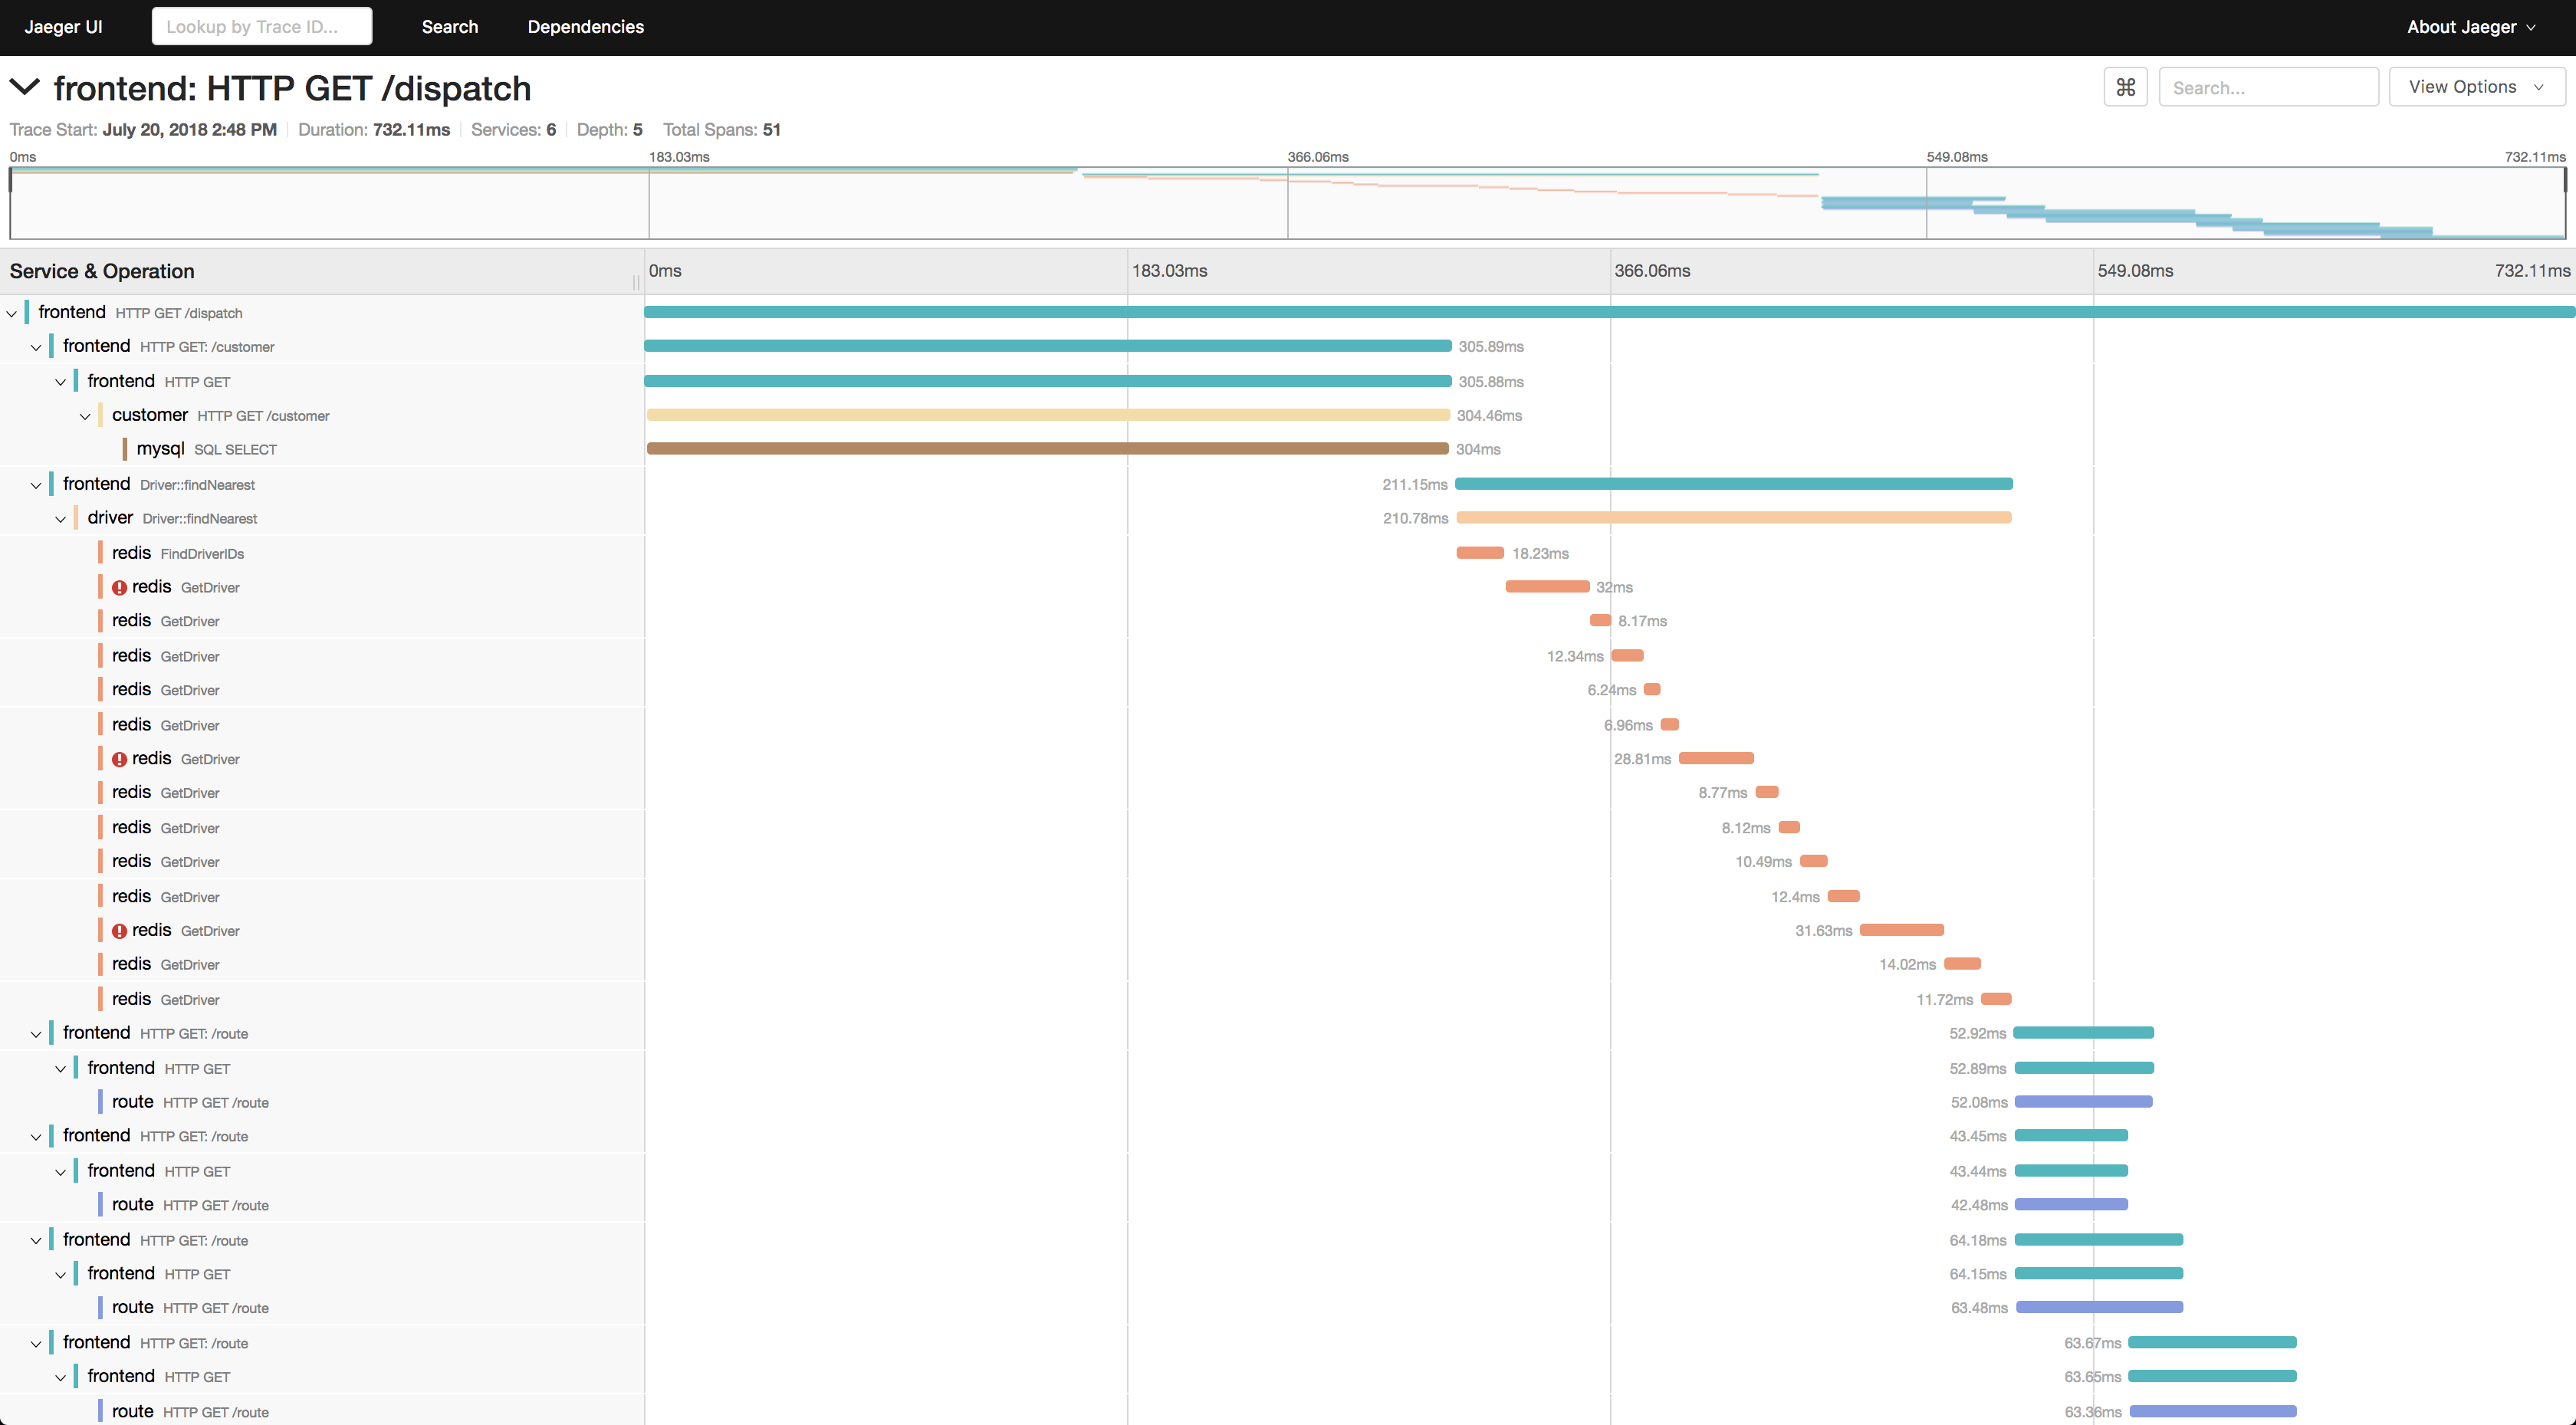
Jaeger's trace view
When we started on the spec of the project, the main points of improvement were
- better timing indicators
- better presentation of function and step duration
While we do have some of that information already in the existing UI, presenting it as text rather than something visual can make a huge difference in how the information is being processed. Because we as humans, are not as good at processing text data as we are at visual patterns.
So, whether you’re skimming through the dashboard for regular manual health checks or you’re swimming through data to debug an issue, a visual pattern is faster to process and less computationally taxing for your brain.
We noticed that distributed tracing already encapsulates most of what we want to do and deliver, so using that as a reference was a no-brainer for us.
OTEL falling short
If you’ve been around for a while, you probably know the term Application Performance Management (APM). It’s been around since the 1990s, and there have been a couple of changes, with Open Telemetry being one of the latest additions to the mix.
Why is this relevant?
Performance management started with function stack monitoring (memory as well, yes) because most code bases were monoliths for a long time. With the exception of Google, a lot of tech companies were still doing function stack monitoring in 2000s and 2010s.
OpenTelemetry or OpenTracing or whatever name it was called before, is basically an extension on top of the function stack monitoring, expanding the monitoring territory across the wire onto different processes/machines. That’s why when you look at a trace and the spans within it, it still very much resembles a function stack because it is just a giant function execution.
Now, given an Inngest function like this,
const hello = inngest.createFunction({ id: "hello-world" },{ event: "test/hello" },async ({ step }) => {await step.run("hello", () => "hello")await step.run("world", () => "world")return "greetings"})
Which one of the following do you think will look like when instrumented with Open Telemetry?
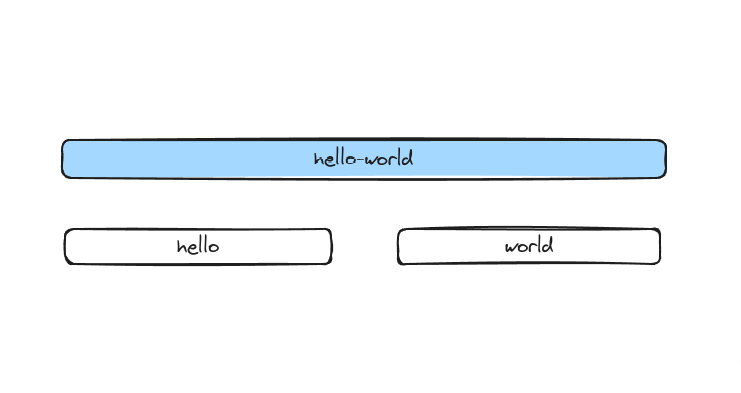
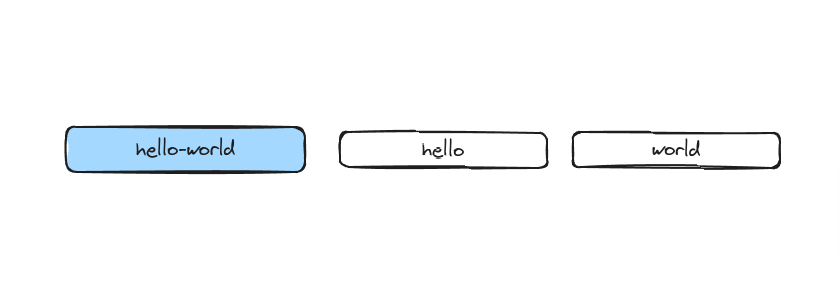
Surprise surprise, the answer is the second one. Why? Let’s take a look at the lifecycle of an Inngest function run.
When Inngest executes a function, it starts by sending a request to the user’s exposed SDK endpoint. This will,
- find the first step (which is
hello) - execute it
- return the result of the step to the executor
- executor records the returned value
The executor will continue 1→4 over and over until the SDK says there’s nothing left to do with the function or the error retries are saturated.
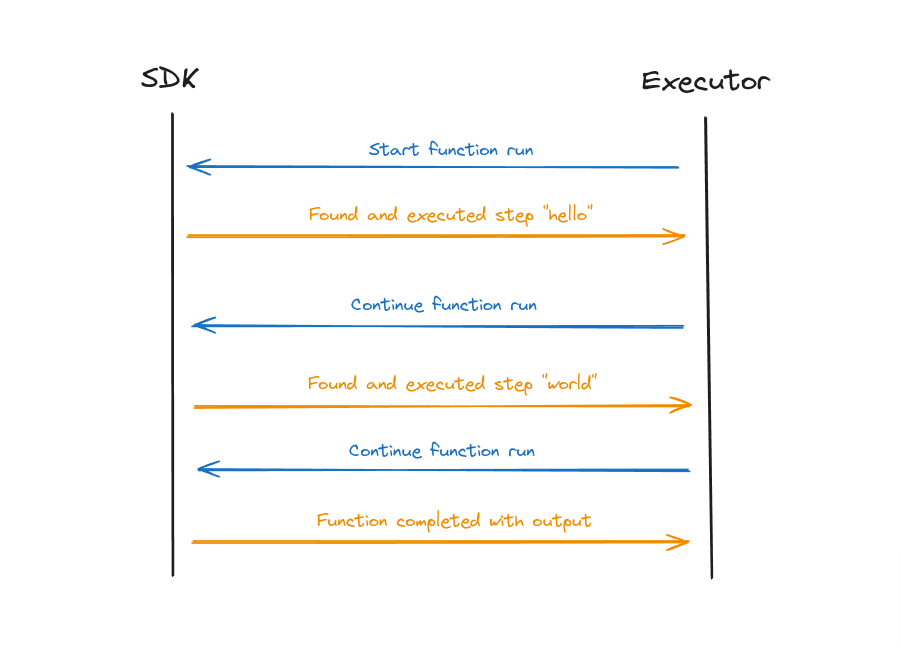
Lifecycle of an Inngest function run
So in reality, if the trace follows the execution, it end up looking like a linked list instead of a function stack. Because Inngest backs your execution with a queue for idempotency and reliability, the data will show that if we let OTEL tracing run its course.
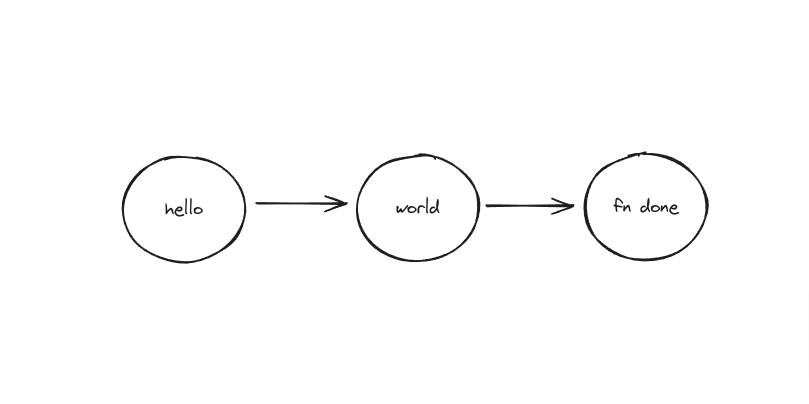
How trace will actually look when an Inngest function run is instrumented
Not the most helpful visualization of a run, isn’t it?
With that understanding out of the way, how do we change this
to this?
The quick answer to that question is we can’t.
At least not with what OpenTelemetry provides out of the box. There’s no way for us to replace or modify previously reported spans, and it’s not included in the spec of OpenTelemetry either. Therefore, there are no interfaces to allow such actions.
Bending OTEL
Well, we obviously were able to do it, but most of what we’ve done didn’t comply with how OTel functions in general.
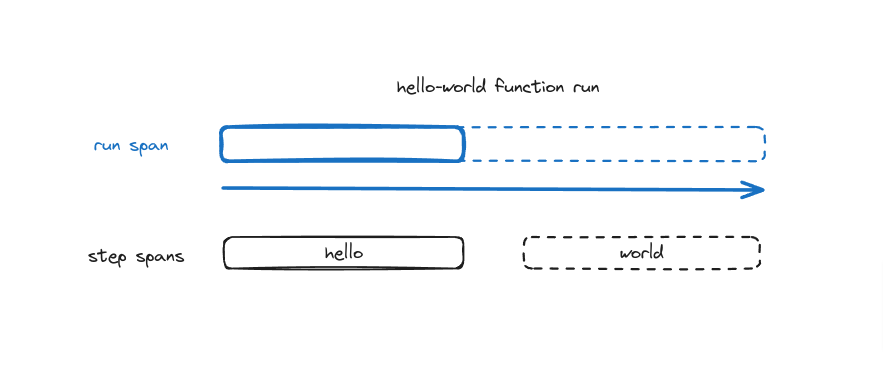
In order to construct a trace that actually looks like a function stack, 2 things need to happen on the span level
- Recreate a similar span over time
- Override a span’s end time/duration
A function run’s duration is not done immediately after the first step, but it is the sum of all the executions and slightly more within the function.
Putting that visually, we can also say the function run span itself needs to expand the duration as the function run continues to execute. The final duration can be in milliseconds or days or months, depending on the type of step the user utilizes.
To accomplish this goal, we need 2 things to work well together.
- Expand OTel to accept provided Span IDs, not just auto generate them
- Storage needs to be somewhat aware of the context and can de-duplicate identical spans as they’re reported
Expanding OTel
If you ever look at OpenTelemetry’s specification for tracing, what we’re trying to do completely flies in the face of it.
Here are some examples what the specs says vs what we want.
A
Span’s start time SHOULD be set to the current time on span creation. After theSpanis created, it SHOULD be possible to change its name, set itsAttributes, addEvents, and set theStatus. These MUST NOT be changed after theSpan’s end time has been set.
We want to override the start time on top of the span IDs. Because we’re reconstructing the run span all over again, in order to make sure it’s identical, pretty much most data except for the duration and end time needs to be the same.
Spans are not meant to be used to propagate information within a process. To prevent misuse, implementations SHOULD NOT provide access to aSpan’s attributes besides itsSpanContext.
We need some level of access to modify a previously reported span.
Vendors may implement the
Spaninterface to effect vendor-specific logic. However, alternative implementations MUST NOT allow callers to createSpans directly. AllSpans MUST be created via aTracer.
The easiest way to construct a custom Span, while still being able to reuse most of OTEL’s plumbing turns out to be to create the Span directly. Ironic.
To accomplish the above goals, we end up creating a Span struct in Inngest’s code base that implements multiple Span interfaces within OTel’s Go library.
As stated above, this was the easiest way to ensure we get what we want when handling instrumentation of function runs without reimplementing the whole OTel plumbing, including exporting, batching, etc.
You can see our custom Span here in GitHub.
Besides the OTel trace interfaces, we also added some helper functions to simplify the instrumentation. It’s rather rare that you need to do things against pretty much everything the library recommends or against the spec itself, but this ensures we can reconstruct the function run span and have all execution and steps be a child of it.
In our case, the resulting shape of the stored data is way more important than the tracing specs itself. That doesn’t mean it wasn’t a pain to work with, though.
Storage
The second piece of the puzzle is the storage itself. The requirements to provide a good experience for our users are,
- Needs to be able to store large amounts of tracing data (easily TBs of them)
- Queries are fast or can be optimized to make it fast
- Have a way to de-duplicate data effectively and ideally easily
We decided to use ClickHouse because it fulfills #1 and #3 very well. For #2, it can be a hit or miss sometimes, but you can’t get everything you want, so we’ll need to make peace with it.
ClickHouse’s capability to store large amounts of data and process them efficiently is pretty well-known at this point, so I’m not going to dive into that. What’s VERY useful for us in this context is the multiple MergeTree engines ClickHouse provides.
For the raw tracing data, we need to de-duplicate the function run spans, and the ReplacingMergeTree can do exactly that. Based on the configured identifiers when creating a table, ClickHouse will automatically take the last thing and replace the previous occurrence of identical data. Our function run spans are all identical besides the Duration value, so this feature pretty much solves one of the biggest headaches if we were to do this on our own.
As for constructing each function run data itself, AggregatingMergeTree has been a lifesaver. We were able to define how data needs to be aggregated from all the spans to form a complete view of the function run, and this make handling parallel steps and any concurrent executions a lot easier.
Drawbacks
Like anything in engineering, not everything is flowers and roses. One of the biggest benefits of using the non default MergeTree engines are also one of its biggest downsides.
To get the latest and most accurate data, ClickHouse has a FINAL keyword that merges data before returning the result for a query.
FROM Clause | ClickHouse Docs
The document mentions it’s slightly slower, but based on our load testing with TBs of data, it’s actually significantly slower.
A similar query without FINAL can be as fast as < 100ms and > 30s with the FINAL modifier set. It’s pretty much unacceptable in terms of performance, even if the data is more accurate.
We ended up doing a couple of query optimizations, including negating the Unix timestamp values on the sorting key to improve certain performance where the FINAL modifier can’t be removed.
CREATE TABLE runs (...)ENGINE = AggregatingMergeTreeORDER BY (aid, wid, ..., -toUnixTimestamp64Milli(queued_at));
This is based on the fact that all data on a ClickHouse table is sorted on disk by the sorting key. By negating the integer timestamp value, all new data automatically gets added to the start of the table. This is a fun trick that helps with querying a long range of data that needs to be paginated, with the caveat that it puts more weight on recent data than older ones.
For data like function runs, a run from 5m ago has a much higher value compared to a run that happened 3 days ago, so this was an easy tradeoff for us.
What’s next?
While the new UI is still in beta, we’ve already received tons of positive and helpful feedback.
The current beta version’s goal is to make the new runs UI feature parity with the existing one, but it’s still great to see people getting value out of it as is.
As we start transitioning the function runs view to a global view, we will be working on enabling more granular filtering utilizing Common Expression Language (CEL), with more interesting engineering challenges to come. Stay tune!
Help shape the future of Inngest
Ask questions, give feedback, and share feature requests
Join our Discord!